
Operation Manual

12-20 Statistics
8212STAT.DOC TI-82, Chapter, English Bob Fedorisko Revised: 02/09/01 9:23 AM Printed: 02/09/01
12:42 PM Page 20 of 22
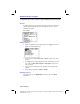
Defining the Plots
1. Press
y
ã
STAT PLOT
ä
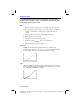
. The
STAT PLOTS
screen shows the current plot
definitions.
2. Select the plot to define (
Plot1
,
Plot2
, or
Plot3
).
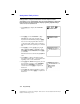
3. If you wish to plot the statistical data immediately, select
On
. You can
define a plot at any time and leave it
Off
. The definition will be available
in the future.
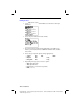
4. Select the type of plot. The options change appropriately:
¦
Scatter: Xlist Ylist Mark
¦
xyLine: Xlist Ylist Mark
¦
Boxplot: Xlist Freq
¦
Histogram: Xlist Freq
5. Depending on the type of plot, select the options:
¦
Xlist
(independent data)
¦
Ylist
(dependent data)
¦
Freq
(frequency,
1
is used if not specified)
¦
Mark
(›,
+
, or
¦
)