
Operation Manual

12-22 Statistics
8212STAT.DOC TI-82, Chapter, English Bob Fedorisko Revised: 02/09/01 9:23 AM Printed: 02/09/01
12:42 PM Page 22 of 22
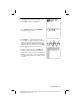
Statistical Plotting in a Program
You may define a plot, select or deselect a plot, and display a plot from a program
Stat Plots
To display a stat plot, you may define the plot(s), then turn on the plot(s),
and then display the graph. (If you do not define the plot, the current
definitions are used).
For example:
Defining a Stat Plot
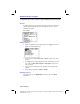
1. Begin on a blank line in the program editor. Press
y
ã
STAT PLOT
ä
to
display the
STAT PLOTS
menu.
2. Select the plot to define.
Plot1
,
Plot2
, or
Plot3
is copied to the cursor
location.
3. Press
y
ã
STAT PLOT
ä
~
to display the
STAT TYPES
menu. Select the
type of plot.
Scatter
,
xyLIne
,
Boxplot
, or
Histogram
is copied to the
cursor location.
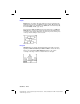
4. Press
¢
then enter list names. See Appendix A for the appropriate
options.
5. Select the type of mark (for
Scatter
or
xyLine
).
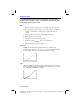
Displaying a Stat Plot
To display a plot, use the
DispGraph
instruction or any of the
ZOOM
instructions.