
Operation Manual

14-4 Applications
8214APPS.DOC TI-82, Chapter 14, English Bob Fedorisko Revised: 02/09/01 9:27 AM Printed:
02/09/01 12:43 PM Page 4 of 20
Speeding Tickets
The fine for speeding in your area is 50 plus 5 per kilometer per hour over the
limit for the first 10 kilometers, plus 10 per kilometer per hour for the next 10
kilometers, plus 20 per kilometer thereafter. Graph the piecewise function that
describes the cost of the ticket in a 45-kilometer-per-hour zone.
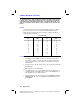
Problem
The fine (
Y
) as a function of kilometers per hour (
X
) is:
Y = 0 0 < X
45
Y = 50 + 5 (X – 45) 45 < X
55
Y = 50 + 5
…
10 + 10 (X – 55) 55 < X
65
Y = 50 + 5
…
10 + 10
…
10 + 20 (X – 65) 65 < X
Procedure
1. Press
z
. Select
Func
,
Dot
, and the defaults. Press
y
[
STAT PLOT
]
and turn off all stat plots.
2. Press
o
. Turn off any selected functions. The
TEST
operations are
used to define piecewise functions. Enter the
Y=
function to describe
the fine.
Y
1
=(50+5(X–45))(45<X)(X
55)
+(100+10(X–55))(55<X)(X
65)
+(200+20(X–65))(65<X)
3. Press
p
and set
Xmin =
M
2
,
Xscl = 10
,
Ymin =
M
5
, and
Yscl = 10
.
Ignore
Xmax
and
Ymax
. (They are set by
@
X
and
@
Y
in step 4.)
4. Press
y
ã
QUIT
ä
to return to the Home screen and store
1
to
@
X
and
5
to
@
Y
. (
@
X
and
@
Y
, the distance between the centers of adjacent pixels,
are on the
VARS Window...
menu.) Defining
@
X
and
@
Y
as integers
produces nice values for
TRACE
.
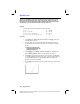
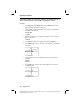
5. Press
r
to plot the functions. At what speed does the ticket exceed
250?