
Operation Manual
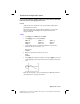

Applications 14-7
8214APPS.DOC TI-82, Chapter 14, English Bob Fedorisko Revised: 02/09/01 9:27 AM Printed:
02/09/01 12:43 PM Page 7 of 20
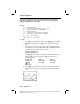
Solving a System of Nonlinear Equations
Solve the equation X
3
–
2X=2cosX graphically. Stated another way, solve the
system of two equations and two unknowns: Y=X
3
–
2X and Y=2cosX. Use the
ZOOM factors to control the decimal places displayed on the graph.
Procedure
1. Press
z
. Select the default
MODE
settings. Press
y
[
STAT PLOT
]
and turn off all stat plots. Press
o
. Turn off all functions and enter the
functions
Y
7
=X
3
–2X
and
Y
8
=2cos X
.
2. Press
q
and select
ZDecimal
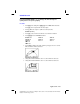
. The display shows that there are two
areas that might contain solutions (points where the two functions
appear to intersect).
3. Press
q
~
and select
SetFactors...
from the
ZOOM MEMORY
menu.
Set
XFact=10
and
YFact=10
.
4. Press
q
2
(to select
Zoom In
). Use
~
,
|
,
}
, and
†
to position the
free-moving cursor on the apparent intersection of the functions on the
right side of the display. As you move the cursor, note that the
X
and
Y
coordinates have one decimal place.
5. Press
Í
to zoom in. Move the cursor over the intersection. As you
move the cursor, note that now the
X
and
Y
coordinates have two
decimal places.
6. Press
Í
to zoom in again. Move the free-moving cursor to a point
exactly on the intersection. Note the number of decimal places.
7. Press
y
ã
CALC
ä
and select
intersect
. Press
Í
to select the
First curve
and
Í
to select the
Second curve
. Now trace to a
Guess
near the intersection and press
Í
. What are the coordinates of the
intersection?
8. Press
q
and select
ZDecimal
to redisplay the original graph.
9. Press
q
. Select
Zoom In
and explore as above the other apparent
intersection.