
Operation Manual

Applications 14-9
8214APPS.DOC TI-82, Chapter 14, English Bob Fedorisko Revised: 02/09/01 9:27 AM Printed:
02/09/01 12:43 PM Page 9 of 20
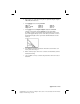
Cobweb Attractors
Using Web WINDOW FORMAT, you can identify points with attracting and
repelling behavior in sequence graphing.
Procedure
1. Press
z
. Select
Seq
. Press
p
~
. Select
Web
and the defaults.
Press
y
[
STAT PLOT
] and turn off all stat plots.
2. Press
o
. Enter the sequence. (
U
n
-
1
is on the keyboard.)
U
n
=KU
n
-
1
(1–U
n
-
1
)
3. Press
y
ã
QUIT
ä
to return to the Home screen and store
2.9
to
K
.
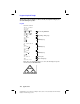
4. Press
p
. Set the
WINDOW
variables.
U
n
Start = .01 Xmin = 0 Ymin = 0
V
n
Start = 0 Xmax = 1 Ymax = 1
n
Start = 0 Xscl = 1 Yscl = 1
n
Min = 0
n
Max = 10
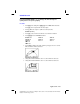
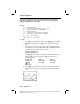
5. Press
r
to display the graph, and then press
~
to trace the cobweb.
This is a cobweb with one attractor.
6. Change
K
to
3.44
and
TRACE
to show a cobweb with two attractors.
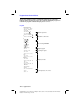
7. Change
K
to
3.54
and
TRACE
to show a cobweb with four attractors.