
Operation Manual

Function Graphing 3-13
8203FUNC.DOC TI-82, Chapter 3, English Bob Fedorisko Revised: 02/09/01 9:06 AM Printed: 02/09/01
12:36 PM Page 13 of 24
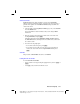
Exploring a Graph with the Free-Moving Cursor
While a graph is displayed, you can move the free-moving cursor anywhere on
the graph and display the coordinates of any location on the graph.
Free-Moving Cursor
You can use
|
,
~
,
}
, or
†
to move the cursor around the graph. When you
first display the graph, no cursor is visible. As soon as you press
|
,
~
,
}
,
or
†
, the cursor moves from the center of the viewing window.
As you move the cursor around the graph, the coordinate values of the
cursor location are displayed at the bottom of the screen (if
CoordOn
).
Coordinate values generally appear in normal floating-decimal format. The
numeric display settings on the
MODE
screen do not affect coordinate
display.
To see the graph without the cursor or coordinate values, press
‘
or
Í
. When you press
|
,
~
,
}
, or
†
, the cursor moves from same
position.
Graphing Accuracy
The free-moving cursor moves from dot to dot on the screen. When you
move the cursor to a dot that appears to be “on” the function, it may be
near, but not on, the function; therefore, the coordinate value displayed at
the bottom of the screen is not necessarily a point on the function. To move
the cursor along a function, use
TRACE
(page 3
.
14).
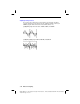
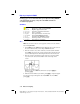
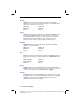
The display coordinate values of the free-moving cursor approximate actual
math coordinates accurate to within the width/height of the dot. As
Xmin
and
Xmax
(and
Ymin
and
Ymax
) get closer together (after a
Zoom In
, for
example), graphing accuracy increases, and the coordinate values more
closely approximate the math coordinates.
)
Free-moving cursor “on” the curve