
Operation Manual

3-14 Function Graphing
8203FUNC.DOC TI-82, Chapter 3, English Bob Fedorisko Revised: 02/09/01 9:06 AM Printed: 02/09/01
12:36 PM Page 14 of 24
Exploring a Graph with TRACE
TRACE moves the cursor from one plotted point to the next along a function,
while displaying the cursor coordinates at the bottom of the screen.
Beginning a Trace
Press
r
to begin a trace. If the graph is not displayed already, the TI
.
82
displays it. The cursor is on the first selected function in the
Y=
list at the
middle
X
value on the screen. The number of the function shows at the
upper right of the display.
Moving along a Function
~
and
|
move the cursor along the function. Each press moves the cursor
from one plotted point to the next.
y
~
and
y
|
move the cursor five
plotted points at a time. The
Y
value is calculated from the
X
value; that is,
Y
=
Y
n
(X)
. If the function is undefined at an
X
value, the
Y
value is blank.
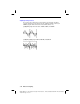
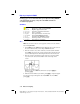
)
TRACE
cursor on the curve.
If the
Y
value of a function is above or below the viewing window, the
cursor disappears as you move it to that portion of the function; however,
the coordinate values at the bottom of the screen indicate the cursor
coordinates.
Panning to the Left or Right
If you trace a function off the left or right edge of the screen, the viewing
window automatically pans to the left or right.
Xmin
and
Xmax
are updated
to correspond to the new viewing window.
QuickZoom
While tracing, you can press
Í
to adjust the viewing
WINDOW
so that
the cursor location becomes the center of the new viewing
WINDOW
, even
if the cursor is above or below the display. This allows “panning” up and
down. After QuickZoom, the cursor remains in
TRACE
.