
Operation Manual

3-16 Function Graphing
8203FUNC.DOC TI-82, Chapter 3, English Bob Fedorisko Revised: 02/09/01 9:06 AM Printed: 02/09/01
12:36 PM Page 16 of 24
Exploring a Graph with ZOOM
Pressing
q
accesses a menu that allows you to adjust the viewing WINDOW
of the graph quickly in a variety of ways. All of the ZOOM commands are
accessible from programs.
ZOOM Menu
ZOOM MEMORY
1: ZBox
Draws box to define viewing
WINDOW
.
2: Zoom In
Magnifies graph around cursor.
3: Zoom Out
Views more of graph around cursor.
4: ZDecimal
Sets .1 as dot size.
5: ZSquare
Sets equal sized dots on
X
and
Y
axes.
6: ZStandard
Sets standard
WINDOW
variables.
7: ZTrig
Sets built-in trig
WINDOW
variables.
8: ZInteger
Sets integer values on
X
and
Y
axes.
9: ZoomStat
Sets values for current lists.
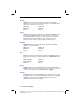
ZBox
ZBox
lets you use the cursor to select opposite corners of a box to define a
new viewing
WINDOW
.
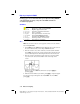
1. Select
ZBox
from the
ZOOM
menu. The different cursor at the center of
the screen indicates that you are using a
ZOOM
instruction.
2. Move the cursor to any corner of the box you want to define and then
press
Í
. As you move the cursor away from the point just selected,
you see a small square dot, indicating that the first corner is selected.
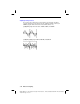
3. Move the cursor to the diagonal corner of the box you want to define.
As you move the cursor, the boundaries of the box change on the
screen.
Note: You can cancel
ZBox
any time before you press
Í
by
pressing
‘
.
4. When the box is defined as you want it, press
Í
to replot the graph.
You can repeat steps 2 through 4 to do another
ZBox
. To cancel
ZBox
,
press
‘
.