
Operation Manual


Parametric Graphing 4-3
8204PARA.DOC TI-82, Chapter 4, English Bob Fedorisko Revised: 02/09/01 9:08 AM Printed: 02/09/01
12:37 PM Page 3 of 6
Defining and Displaying a Parametric Graph
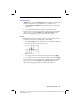
Parametric equations consist of an X component and a Y component, each
expressed in terms of the same independent variable T. They are often used to
graph equations over time. Up to six pairs of parametric equations can be defined
and graphed at a time.
Defining a Parametric Graph
The steps for defining a parametric graph are the same as those for defining
a function graph. Differences are noted below.
Setting Parametric Graph Modes
Press
z
to display the
MODE
settings. To graph parametric equations,
you must select
Par
before you enter
WINDOW
variables or enter the
components of parametric equations. Also, you usually should select
Connected
to obtain a more meaningful
Par
graph.
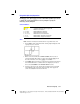
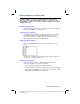
Displaying Parametric Equations
After selecting
Par
MODE
, press
o
to display the parametric
Y=
edit
screen.
On this screen, you display and enter both
X
and
Y
components. TI
.
82 has
six equations, each defined in terms of
T
.
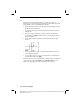
Defining Parametric Equations
Follow the same procedures as for
Func
graphing to enter the two
components that define a new parametric equation.
¦
You must define both the
X
and
Y
components in a pair.
¦
The independent variable in each component is
T
. You may press
„
,
rather than pressing
ƒ
ã
T
ä
, to enter the parametric variable
T
. (
Par
MODE
defines the independent variable as
T
.)