
Operation Manual


4-4 Parametric Graphing
8204PARA.DOC TI-82, Chapter 4, English Bob Fedorisko Revised: 02/09/01 9:08 AM Printed: 02/09/01
12:37 PM Page 4 of 6
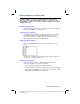
Selecting Parametric Equations
Only the selected parametric equations are graphed. The
=
sign on both
components of selected equations is highlighted. You may select any or all
of the equations on the parametric
Y=
edit screen.
To change the selection status of a parametric equation, press
|
to move
the cursor onto the
=
sign on either the
X
or
Y
component and press
Í
.
The status on both the
X
and
Y
components is changed.
Note: When you enter both components of an equation or edit either
component, that equation is selected automatically.
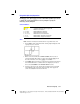
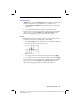
Setting WINDOW Variables
Press
p
to display the current
WINDOW
variable values. The
WINDOW
variables define the viewing
WINDOW
. The values shown are the
standard values in
Radian
MODE
.
Tmin=0
Smallest
T
value to evaluate
Tmax=6.2831853
…
Largest
T
value to evaluate (2
p
)
Tstep=.1308996
…
T
value increment (
pà
24)
Xmin=-10
Smallest
X
value to be displayed
Xmax=10
Largest
X
value to be displayed
Xscl=1
Spacing between
X
tick marks
Ymin=-10
Smallest
Y
value to be displayed
Ymax=10
Largest
Y
value to be displayed
Yscl=1
Spacing between
Y
tick marks
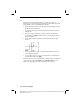
You may want to change the
T
WINDOW
variable values to ensure that
sufficient points are plotted.