
Operation Manual

5-2 Polar Graphing
8205POLR.DOC TI-82, Chapter 5, English Bob Fedorisko Revised: 02/09/01 9:09 AM Printed: 02/09/01
12:37 PM Page 2 of 6
Getting Started: Polar Rose
Getting Started is a fast-paced introduction. Read the chapter for details.
The polar equation A sin B
q
graphs a rose. Graph the rose for A=8 and B=2.5, and
then explore the appearance of the rose for other values of A and B.
1. Press
z
. Press
†
†
†
~
~
Í
to select
Pol
MODE
. Choose the initial settings for the
other modes (the choice at the beginning of
each line).
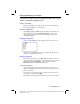
2. Press
o
to display the polar
Y=
edit screen.
Press
8
˜
2.5
„
Í
to define
r
1
.
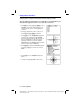
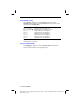
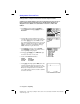
3. Press
q
6
to select
ZStandard
to graph the
equation in the standard viewing
WINDOW
.
Notice that the graph shows only five petals of
the rose and that the rose does not appear
symmetrical. This is because the standard
WINDOW
defines the
WINDOW
(rather than the
pixels) as square and sets
q
max=2
p
.
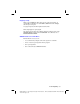
4. Press
p
to display the
WINDOW
settings.
Press
†
†
4
y
ã
p
ä
to increase the value of
q
max
.
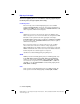
5. Press
q
5
to select
ZSquare
and plot the
graph.
6. Continue, changing
A
and
B
to other values.