
Operation Manual

Polar Graphing 5-3
8205POLR.DOC TI-82, Chapter 5, English Bob Fedorisko Revised: 02/09/01 9:09 AM Printed: 02/09/01
12:37 PM Page 3 of 6
Defining and Displaying a Polar Graph
Polar equations are defined in terms of the independent variable
q
. Up to six polar
equations can be defined and graphed at a time.
Defining a Polar Graph
The steps for defining a polar graph are the same as those for defining a
function graph. Differences are noted below.
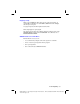
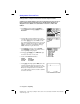
Setting Polar Graph Modes
Press
z
to display the
MODE
settings. To graph polar equations, you
must select
Pol
before you enter
WINDOW
variables or enter a polar
equation. Also, you usually should select
Connected
to obtain a more
meaningful
Pol
graph.
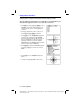
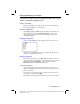
Displaying Polar Equations
After selecting
Pol
MODE
, press
o
to display the polar
Y=
edit screen.
On this screen, you display and enter polar equations. The TI
.
82 has six
equations, each defined in terms of
q
.
Defining Polar Equations
Follow the same procedures as for
Func
graphing to define a new polar
equation. The independent variable in a polar equation is
q
. You may press
„
, rather than pressing
ƒ
ã
q
ä
, to enter the polar variable
q
.
(
Pol
MODE
defines the independent variable as
q
.)
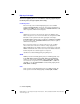
Selecting Polar Equations
Only the selected polar equations are graphed. The
=
sign on selected
equations is highlighted. You may select any or all of the equations on the
polar
Y=
edit screen.
To change the selection status of a polar equation, press
|
to move the
cursor onto the
=
sign and press
Í
.
Note: When you edit an equation, that equation is selected automatically.