
Operation Manual


14-6 Applications
8214APPS.DOC TI-82, Chapter 14, English Bob Fedorisko Revised: 02/09/01 9:27 AM Printed:
02/09/01 12:43 PM Page 6 of 20
Graphing Inequalities
Examine the inequality
.
4X
3
–3X+5<
.
2X+4 graphically. Use the TEST functions to
explore the values of X where the inequality is true and where it is false.
Procedure
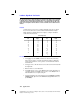
1. Press
z
. Select
Dot
,
Simul
, and the default
MODE
settings. Press
y
[
STAT PLOT
] and turn off all stat plots.
2. Press
o
. Turn off all functions. Enter the left side of the inequality as
Y
4
and the right side as
Y
5
.
Y
4
=.4X
3
–3X+5
Y
5
=.2X+4
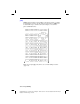
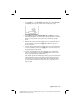
3. Enter the statement of the inequality as
Y
6
. This function evaluates to 1
if true and 0 if false.
Y
6
=Y
4
<Y
5
4. Press
q
6
to graph the inequality in the standard
WINDOW
.
5. Press
r
†
†
to move to
Y
6
and trace the inequality, observing the
value of
Y
.
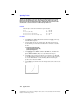
6. Press
o
. Turn off
Y
4
,
Y
5
, and
Y
6
. Enter equations to graph only the
inequality.
Y
7
=Y
6
Y
4
Y
8
=Y
6
Y
5
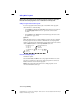
7. Press
r
. Notice that the values of
Y
7
and
Y
8
are zero where the
inequality is false.