
Operation Manual


3-2 Function Graphing
8203FUNC.DOC TI-82, Chapter 3, English Bob Fedorisko Revised: 02/09/01 9:06 AM Printed: 02/09/01
12:36 PM Page 2 of 24
Getting Started: Graphing a Circle
Getting Started is a fast-paced introduction. Read the chapter for details.
Graph a circle of radius 10, centered on the origin in the standard viewing
window. To graph a circle, you must enter separate formulas for the upper and
lower portions of the circle. Then use ZOOM Square to adjust the display to make
the functions appear as a circle.
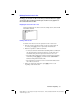
1. In
Func
MODE
, press
o
to display the
Y=
edit
screen. Press
y
ã
‡
ä
£
100
¹
„
¡
¤
Í
to enter the expression to define the top half of
the circle,
Y
1
=
‡
(100–X
2
)
.
The bottom half of the circle is defined by
Y
2
=
M‡
(100–X
2
)
. However, on the TI
.
82 you can
define one function in terms of another, so to
define
Y
2
=
M
Y
1
, press
Ì
y
ã
Y
.
VARS
ä
(to display
the
Y=
variables menu)
1
(to select
Function...
)
1
(to select
Y
1
).
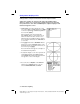
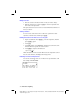
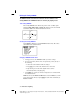
2. Press
q
and then select
ZStandard
. This is a
quick way to reset the
WINDOW
variables to the
standard values. It also graphs the functions; you
do not need to press
s
.
Notice that the functions appear as an ellipse in
the standard viewing window.
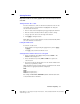
3. To adjust the display so each “dot” represents an
equal width and height, press
q
and then
select
ZSquare
. The functions are replotted and
now appear as a circle on the display.
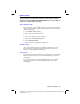
4. To see the effect of
ZSquare
on the
WINDOW
variables, press
p
and notice the new
values for
Xmin
,
Xmax
,
Ymin
, and
Ymax
.