
Operation Manual


3-4 Function Graphing
8203FUNC.DOC TI-82, Chapter 3, English Bob Fedorisko Revised: 02/09/01 9:06 AM Printed: 02/09/01
12:36 PM Page 4 of 24
Setting Graph Modes
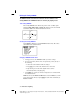
Pressing
z
displays the current MODE settings (Chapter 1). The graphing
MODE in function graphing must be Func.
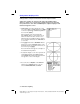
Checking and Changing Graphing Modes
Press
z
to display the
MODE
settings. The current settings are
highlighted.
The TI
.
82 has four graphing modes.
¦
Func
(function graphing)
¦
Par
(parametric graphing)
¦
Pol
(polar graphing)
¦
Seq
(sequence graphing)
To graph functions, you must select
Func
(function graphing). The basics
of graphing on the TI
.
82 are described in this chapter. Differences in
parametric graphing (Chapter 4), polar graphing (Chapter 5), and sequence
graphing (Chapter 6) are described in those chapters.
Radian
or
Degree
MODE
may affect how some functions are interpreted.
Connected
or
Dot
affects how the selected functions are plotted.
Sequential
or
Simul
affects how functions are plotted if you have more
than one function selected.
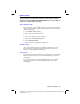
Setting Modes from a Program
You may set the graphing mode and other modes from a program.
Begin on a blank line in the program editor. Press
z
to display the
interactive
MODE
selection screen. Use
†
,
}
,
~
, and
|
to place the cursor
on the
MODE
that you want to select, and press
Í
. The name of the
MODE
is copied to the cursor location.