
Operation Manual


Chapter 4: Parametric Graphing 97
Defining and Displaying Parametric Graphs
Graphing Mode Similarities
The steps for defining a parametric graph are similar to the steps for defining a function graph.
Chapter 4 assumes that you are familiar with Chapter 3: Function Graphing. Chapter 4 details aspects of
parametric graphing that differ from function graphing.
Setting Parametric Graphing Mode
To display the mode screen, press z. To graph parametric equations, you must select parametric
graphing mode before you enter window variables and before you enter the components of
parametric equations.
Displaying the Parametric Y= Editor
After selecting parametric graphing mode, press o to display the parametric Y= editor.
In this editor, you can display and enter both the X and Y components of up to six equations,
X1T and
Y1T through X6T and Y6T. Each is defined in terms of the independent variable T. A common
application of parametric graphs is graphing equations over time.
Selecting a Graph Style
The icons to the left of X1T through X6T represent the graph style of each parametric equation.Use the
styles and color to visually differentiate equations to be graphed together. This table describes the
graph styles available for parametric graphing.
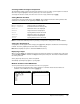
12. Press s. The plotting action simultaneously shows the
ball in flight and the vertical and horizontal component
vectors of the motion.
Note: To simulate the ball flying through the air, set graph
style to ì (animate) for
X1T and Y1T.
13. Press r to obtain numerical results and answer the
questions at the beginning of this section.
Tracing begins at
Tmin on the first parametric equation (X1T
and
Y1T). As you press ~ to trace the curve, the cursor
follows the path of the ball over time. The values for X
(distance), Y (height), and T (time) are displayed at the
bottom of the screen.
Icon Style Description
ç Thin A solid line connects plotted points.