
Operation Manual


Chapter 6: Sequence Graphing 114
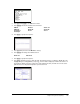
2. Press y . Í to set Time axes format.
3. Press p and set the variables as shown below.
4. Press s to graph the sequence.
5. Press y . and select the
Web axes setting.
6. Press p and change the variables below.
7. Press s to graph the sequence.
8. Press r, and then press ~ to draw the web. The displayed cursor coordinates
n, X (u(nN1)), and
Y (u(n)) change accordingly. When you press ~, a new n value is displayed, and the trace cursor is on
the sequence. When you press ~ again, the n value remains the same, and the cursor moves to the
y=x reference line. This pattern repeats as you trace the web.
nMin=1
nMax=25
PlotStart=1
PlotStep=1
Xmin=0
Xmax=25
Xscl=1
Ymin=
L10
Ymax=10
Yscl=1
Xmin=
L10
Xmax=10