
Operation Manual


Chapter 6: Sequence Graphing 115
Graphing Phase Plots
Graphing with uv, vw, and uw
The phase-plot axes settings uv, vw, and uw show relationships between two sequences. To select a
phase-plot axes setting, press y., press ~ until the cursor is on
uv, vw, or uw, and then press
Í.
Example: Predator-Prey Model
Use the predator-prey model to determine the regional populations of a predator and its prey that
would maintain population equilibrium for the two species.
This example uses the model to determine the equilibrium populations of foxes and rabbits, with initial
populations of 200 rabbits (
u(nMin)) and 50 foxes (v(nMin)).
These are the variables (given values are in parentheses):
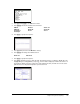
1. Press o in
Seq mode to display the sequence Y= editor. Define the sequences and initial values for
R
n
and W
n
as shown below. Enter the sequence R
n
as u(n) and enter the sequence W
n
as v(n).
2. Press y . Í to select Time axes format.
Axes Setting x-axis y-axis
uv
u(
n)v(n)
vw
v(
n)w(n)
uw
u(
n)w(n)
R = number of rabbits
M = rabbit population growth rate without foxes (.05)
K = rabbit population death rate with foxes (.001)
W = number of foxes
G = fox population growth rate with rabbits (.0002)
D = fox population death rate without rabbits (.03)
n
= time (in months)
R
n
=R
nN1
(1+MNKW
nN1
)
W
n
=W
nN1
(1+GR
nN1
ND)