
Operation Manual


Chapter 6: Sequence Graphing 116
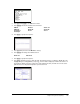
3. Press p and set the variables as shown below.
4. Press s to graph the sequence.
5. Press r ~ to individually trace the number of rabbits (
u(n)) and foxes (v(n)) over time (n).
Note: Press a number, and then press Í to jump to a specific
n value (month) while in TRACE.
6. Press y . ~ ~ Í to select
uv axes format.
7. Press p and change these variables as shown below.
8. Press r. Trace both the number of rabbits (X) and the number of foxes (Y) through 400
generations.
nMin=0
nMax=400
PlotStart=1
PlotStep=1
Xmin=0
Xmax=400
Xscl=100
Ymin=0
Ymax=300
Yscl=100
Xmin=84
Xmax=237
Xscl=50
Ymin=25
Ymax=75
Yscl=10
Note: When you press r, the equation for u is
displayed in the top-left corner. Press } or † to see
the equation for
v.