
Operation Manual


Chapter 7: Tables 117
Chapter 7:
Tables
Getting Started: Roots of a Function
Getting Started is a fast-paced introduction. Read the chapter for details.
Evaluate the function Y = X
3
N 2X at each integer between L10 and 10. How many sign changes occur,
and at what X values?
Setting Up the Table
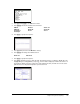
TABLE SETUP Screen
To display the TABLE SETUP screen, press y -.
1. Press z † † † Í to set
Func graphing mode.
2. Press o. Press „
3 to select
3
. Then press
¹
2 „ to enter the function Y1=X
3
N2X.
3. Press y - to display the TABLE SETUP screen:
• Press Ì 10 Í to set TblStart= L10.
• Press 1
Í to set @Tbl= 1.
•
Press Í to select Indpnt: Auto
(automatically generated independent
values).
• Press † Í to select Depend: Auto
(automatically generated dependent
values).
4. Press y 0 to display the table screen.
Note: The message on the status bar, “Press + for
@Tbl” is a reminder that you can change @Tbl from
this table view.
5. Press †until you see the sign changes in the value of
Y1. How many sign changes occur, and at what X
values?
In this case, you can also see the roots of the function
by finding when Y1=0. You can explore changes in X
by pressing Ã
to display the @Tbl prompt, entering a
new value, and searching for your answer.