
Operation Manual


Chapter 7: Tables 120
Note: When the table first displays, the message “Press + for @Tbl” is on the status bar. This message
reminds you that you can select an independent variable for a new
TblStart and press à to change
@Tbl at any time.
Independent and Dependent Variables
The current graphing mode determines which independent and dependent variables are displayed in
the table. In the table above, for example, the independent variable X and the dependent variables
Y1
and Y2 are displayed because Func graphing mode is set.
Clearing the Table from the Home Screen or a Program
From the home screen, select the ClrTable instruction from the CATALOG. To clear the table, press
Í. This clears the table for Ask modes on y -.
From a program, select
9:ClrTable from the PRGM I/O menu or from the CATALOG. The table is cleared
upon execution. If IndpntAsk is selected, all independent and dependent variable values on the table
are cleared. If DependAsk is selected, all dependent variable values on the table are cleared.
Scrolling Independent-Variable Values
If Indpnt: Auto is selected, you can press } and † in the independent-variable column to display more
values. As you scroll the column, the corresponding dependent-variable values also are displayed. All
dependent-variable values may not be displayed if Depend: Ask is selected.
Note: You can scroll back from the value entered for
TblStart. As you scroll, TblStart is updated
automatically to the value shown on the top line of the table. In the example above, TblStart=0 and
@Tbl=1 generates and displays values of X=0, …, 6; but you can press } to scroll back and display the
table for X=M1, …, 5.
Graphing Mode
Independent
Variable Dependent Variable
Func (function) X
Y1 through Y9, and Y0
Par (parametric) T X1T/Y1T through X6T/Y6T
Pol (polar) q r1 through r6
Seq (sequence)
n
u(n), v(n), and w(n)
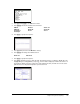
Current cell
Current cell’s full value
Dependent-variable
values in the second
and third columns
Independent-variable
values in the first
column