
TI-84 Plus and Silver Edition Manual

Appendix A: Tables and Reference Information 117
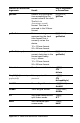
DiagnosticOn Sets diagnostics-on mode;
r, r
2
, and R
2
are displayed
as regression model
results.
y N
DiagnosticOn
dim(
listname) Returns the dimension of
listname.
y 9
OPS
3:dim(
dim(
matrixname) Returns the dimension of
matrixname as a list.
y >
MATH
3:dim(
length!dim(listname) Assigns a new dimension
(length) to a new or
existing listname.
y 9
OPS
3:dim(
{
rows,columns}!
dim(matrixname)
Assigns new dimensions
to a new or existing
matrixname.
y >
MATH
3:dim(
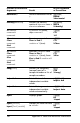
Disp
Displays the home screen. †
I/O
3:Disp
Disp
[valueA,valueB,
valueC,...,value n]
Displays each value. †
I/O
3:Disp
DispGraph
Displays the graph. †
I/O
4:DispGraph
DispTable
Displays the table. †
I/O
5:DispTable
value4DMS Displays value in DMS
format.
y ;
ANGLE
4:4DMS
Dot
Sets dot plotting mode;
resets all Y= editor graph-
style settings to í .
† z
Dot
Function or Instruction/
Arguments
Result
Key or Keys/Menu
or Screen/Item