
TI-84 Plus and Silver Edition Manual

76 Activities
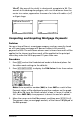
Now compare the graph of the amount of interest with the graph of the
amount of principal for each payment.
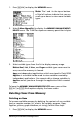
4. Press z. Set
Par and Simul.
5. Press o. Turn off all functions and stat plots. Enter these equations
and set the graph styles as shown.
Note: GPrn( and GInt( are located on the FINANCE menu (APPS
1:FINANCE
).
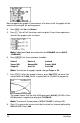
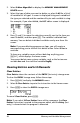
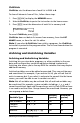
6. Press p. Set these window variables.
Note: To increase the graph speed, change Ts te p to 24.
7. Press r. After the graph is drawn, press
240 Í to move the
trace cursor to
T=240, which is equivalent to 20 years of payments.
The graph shows that for the 240th payment (X=240), 358.03 of the
800 payment is applied to principal (
Y=358.03).
Note: The sum of the payments (Y3T=Y1T+Y2T) is always 800.
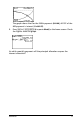
8. Press † to move the cursor onto the function for interest defined by
X2T and Y2T. Enter 240.
Tmin=1
Tmax=360
Tstep=12
Xmin=0
Xmax=360
Xscl=10
Ymin=0
Ymax=1000
Yscl=100