
User Guide


Chapter 8: Draw Instructions 128
Shading Areas on a Graph
Shading a Graph
To shade an area on a graph, select
7:Shade( from the DRAW menu. The instruction is pasted to
the home screen or to the program editor.
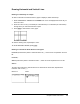
Shade(lowerfunc,upperfunc[,Xleft,Xright,pattern,patres])
Shade(
draws lowerfunc and upperfunc in terms of X on the current graph and shades the area that is
specifically above
lowerfunc and below upperfunc. Only the areas where lowerfunc < upperfunc are
shaded.
Xleft and Xright, if included, specify left and right boundaries for the shading. Xleft and Xright must be
numbers between
Xmin and Xmax, which are the defaults.
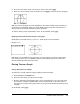
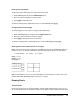
pattern specifies one of four shading patterns.
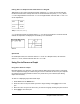
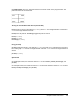
patres specifies one of eight shading resolutions.
Drawing Circles
Drawing a Circle Directly on a Graph
To draw a circle directly on a displayed graph using the cursor, follow these steps.
1. Select 9:Circle( from the DRAW menu.
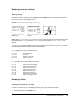
MathPrint™
Classic
pattern=1
pattern=2
pattern=3
pattern=4
vertical (default)
horizontal
negative—slope 45¡
positive—slope 45¡
patres=1
patres=2
patres=3
patres=4
patres=5
patres=6
patres=7
patres=8
shades every pixel (default)
shades every second pixel
shades every third pixel
shades every fourth pixel
shades every fifth pixel
shades every sixth pixel
shades every seventh pixel
shades every eighth pixel