
User Guide


Chapter 17: Activities 311
2. Press q 4 to select 4:ZDecimal. The display shows that two solutions may exist (points
where the two functions appear to intersect).
3. Press q ~ 4 to select 4:SetFactors from the ZOOM MEMORY menu. Set XFact=10 and
YFact=10.
4. Press q 2 to select 2:Zoom In. Use |, ~, }, and † to move the free-moving cursor onto
the apparent intersection of the functions on the right side of the display. As you move the
cursor, notice that the
X and Y values have one decimal place.
5. Press Í to zoom in. Move the cursor over the intersection. As you move the cursor, notice
that now the
X and Y values have two decimal places.
6. Press Í to zoom in again. Move the free-moving cursor onto a point exactly on the
intersection. Notice the number of decimal places.
7. Press y / 5 to select 5:intersect. Press Í to select the first curve and Í to select
the second curve. To guess, move the trace cursor near the intersection. Press
Í. What
are the coordinates of the intersection point?
8. Press q 4 to select 4:ZDecimal to redisplay the original graph.
9. Press q. Select 2:Zoom In and repeat steps 4 through 8 to explore the apparent function
intersection on the left side of the display.
Using a Program to Create the Sierpinski Triangle
Setting up the Program
This program creates a drawing of a famous fractal, the Sierpinski Triangle, and stores the
drawing to a picture. To begin, press ~ ~
1. Name the program SIERPINS, and then press
Í. The program editor is displayed.
Note: After you run this program, press y . † † † Í to turn on the axes in the graph
screen.
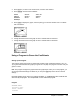
Program
PROGRAM:SIERPINS
:FnOff :ClrDraw
:PlotsOff
:AxesOff
:0!Xmin:1!Xmax
:0!Ymin:1!Ymax
Set viewing window.
:rand!X:rand!Y