
User Guide


Chapter 3: Function Graphing 74
1. Enter the value you want to store.
2. Press ¿.
3. Press to display the VARS menu.
4. Select 1:Window to display the Func window variables (X/Y secondary menu).
• Press ~ to display the Par and Pol window variables (T/q secondary menu).
• Press ~ ~ to display the Seq window variables (U/V/W secondary menu).
5. Select the window variable to which you want to store a value. The name of the variable is
pasted to the current cursor location.
6. Press Í to complete the instruction.
When the instruction is executed, the TI-84 Plus stores the value to the window variable and
displays the value.
@X and @Y
ΔX
Xmax Xmin–()
94
---------------------------------------=
The variables @X and @Y (items 8 and 9 on the VARS (1:Window) X/Y secondary menu; @X is also
on the Window screen) define the distance from the center of one pixel to the center of any
adjacent pixel on a graph (graphing accuracy). @
X and @Y are calculated from Xmin, Xmax, Ymin,
and
Ymax when you display a graph.
ΔY
Ymax Ymin–()
62
---------------------------------------=
You can store values to @X and @Y. If you do, Xmax and Ymax are calculated from @X, Xmin, @Y,
and
Ymin.
Note: The ZFrac ZOOM settings (Zfrac1/2, ZFrac1/3, ZFrac1/4, ZFrac1/5, ZFrac1/8, ZFrac1/10)
change @
X and @Y to fractional values. If fractions are not needed for your problem, you can adjust
@
X and @Y to suit your needs.
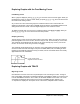
Setting the Graph Format
Displaying the Format Settings
To display the format settings, press y .. The default settings are highlighted below.
Note: You can also go to the Format Graph screen from the Mode screen by selecting YES at the
GoTo Format Graph prompt. After you make changes, press z to return to the Mode screen.
RectGC PolarGC
Sets cursor coordinates.
CoordOn CoordOff
Sets coordinates display on or off.
GridOff GridOn
Sets grid off or on.