
User Guide


Chapter 3: Function Graphing 77
• Changed the value of a variable in a selected function
• Changed a window variable or graph format setting
• Cleared drawings by selecting
ClrDraw
• Changed a stat plot definition
Overlaying Functions on a Graph
On the TI-84 Plus, you can graph one or more new functions without replotting existing functions.
For example, store
sin(X) to Y1 in the Y= editor and press s. Then store cos(X) to Y2 and
press s again. The function Y2 is graphed on top of Y1, the original function.
Graphing a Family of Curves
If you enter a list (Chapter 11) as an element in an expression, the TI-84 Plus plots the function for
each value in the list, thereby graphing a family of curves. In Simul graphing-order mode, it graphs
all functions sequentially for the first element in each list, and then for the second, and so on.
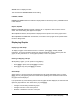
{2,4,6}sin(X) graphs three functions: 2 sin(X), 4 sin(X), and 6 sin(X).
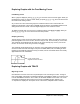
{2,4,6}sin({1,2,3}X) graphs 2 sin(X), 4 sin(2X), and 6 sin(3X) .
Note: When using more than one list, the lists must have the same dimensions.