
Calculator User Manual


Chapter 6: Graph Tools
89
06TOOLS.DOC TI-86, Chap 6, US English Bob Fedorisko Revised: 02/13/01 2:23 PM Printed: 02/13/01 3:01 PM Page 89 of 2206TOOLS.DOC TI-86, Chap 6, US English Bob Fedorisko Revised: 02/13/01 2:23 PM Printed: 02/13/01 3:01 PM Page 89 of 22
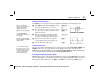
Using the Free-Moving Cursor
When you select
GRAPH
from the
GRAPH
menu, the graph
screen is displayed with the free-moving cursor at the
center of the screen.
The cursor appears as a plus sign with a flashing center
pixel. To move the cursor, press
"
,
#
,
!
, or
$
; it moves
in the direction of the cursor key you press.
♦
In
RectGC
format, each cursor movement updates the variables
x
and
y
. In
PolarGC
format, each cursor movement updates
x
,
y
,
R
, and
q
.
♦
In
CoordOn
format, the
x
and
y
cursor coordinates are displayed at the bottom of the
graph screen as you move the cursor.
Graphing Accuracy
The coordinate values displayed as you move the cursor approximate actual mathematical
coordinates, accurate to within the width and height of the pixel. As the difference between
xMin
and
xMax
and between
yMin
and
yMax
becomes smaller (for example, when you zoom
in on a graph), graphing is more accurate and coordinate values approximate the actual
mathematical coordinates more closely.
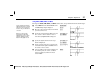
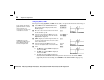
The free-moving cursor coordinates represent the cursor location on the graph screen.
Moving the free-moving cursor precisely from one plotted point to the next along a function
is very difficult. To move along a function easily, use the trace cursor (page 90).
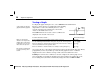
In the example, the function
y(x)=x^3+.3x
2
-4x
is graphed.
The numeric display mode
settings do not affect
coordinate display.