
Calculator User Manual


90
Chapter 6: Graph Tools
06TOOLS.DOC TI-86, Chap 6, US English Bob Fedorisko Revised: 02/13/01 2:23 PM Printed: 02/13/01 3:01 PM Page 90 of 2206TOOLS.DOC TI-86, Chap 6, US English Bob Fedorisko Revised: 02/13/01 2:23 PM Printed: 02/13/01 3:01 PM Page 90 of 22
Tracing a Graph
To display the graph and begin a trace, select
TRACE
from the
GRAPH
menu.
The trace cursor appears as a small square with a flashing
diagonal line at each corner. Initially, the trace cursor
appears on the first selected function, at the
x
value
closest to the middle of the screen.
If
CoordOn
format is selected, the cursor coordinates are
displayed at the bottom of the screen.
To move the trace cursor... Press these keys:
To the next larger or next smaller plotted point in a function
"
or
!
To any valid independent-variable value (
x
,
q
, or
t
) on the current equation
value
b
From one function to another function at
x
, in the order or reverse order of
the selected functions in the equation editor
#
or
$
From one member to another member of a family of curves (Chapter 5)
#
or
$
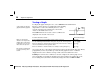
As you move the trace cursor along a function, the
y
value is calculated from the
x
value. That is,
y=y
n
(x)
. When you trace beyond the top or bottom of the graph screen, the coordinates
displayed on the screen continue to change as if the cursor were still on the screen.
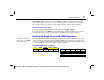
Panning:
To view function coordinates to the left or right of the current graph screen,
press and hold
!
or
"
while tracing. When you pan beyond the left or right side of the
screen during a trace, the TI
-
86 automatically changes the values of
xMin
and
xMax
.
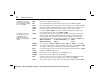
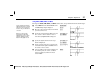
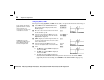
In the example, the function
y(x)=x^3+.3x
2
-4x
is graphed.
When you enter the first
character of an independent
variable value, an
x=
prompt
is displayed (or
q
=
or
t=
). The
value can be an expression.
If the function is undefined at
an
x
value, then the
y
value
is blank.