
Calculator User Manual


Chapter 6: Graph Tools
93
06TOOLS.DOC TI-86, Chap 6, US English Bob Fedorisko Revised: 02/13/01 2:23 PM Printed: 02/13/01 3:01 PM Page 93 of 2206TOOLS.DOC TI-86, Chap 6, US English Bob Fedorisko Revised: 02/13/01 2:23 PM Printed: 02/13/01 3:01 PM Page 93 of 22
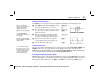
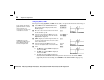
Defining a Custom Zoom In
Using
BOX
, you can zoom in on any rectangular area within the current graph screen.
Select
BOX
from the
GRAPH
ZOOM
menu. The
zoom cursor is displayed at center screen.
Move the cursor to any spot you want to define
as a corner of the zoom box; mark the corner
with a small square.
6
(
&
"
#
!
$
b
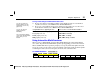
Move the cursor away from the first corner,
creating an adjustable box whose diagonal
corners are the small square and the cursor.
When you have defined the box, replot all
selected functions in the new graph screen.
Clear the menus from the screen.
"
#
!
$
b
:
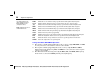
Setting Zoom Factors
Zoom factors define the magnification or reduction factor by which
ZIN
,
ZOUT
,
ZOOMX
, and
ZOOMY
zoom in or zoom out around a point. To display the zoom factors editor, select
ZFACT
from the
GRAPH
ZOOM
menu (press
6
(
/
/
'
).
xFact
and
yFact
must
be
‚
1. The default value for both factors is
4
in all graphing modes.
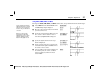
Zooming In and Zooming Out on a Graph
ZIN
magnifies the part of the graph surrounding the cursor location.
ZOUT
displays a greater
portion of the graph, centered on the cursor location.
xFact
and
yFact
determine the extent.
The steps below describe how to use
ZIN
. To use
ZOUT
, select it instead of
ZIN
in step 2.
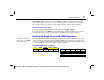
Before you begin these
steps, enter a function in the
equation editor. In the
example, the function
y(x)=x^3+.3x
2
N
4x
is graphed.
To cancel
BOX
without
redefining the graph screen,
press
:
.
When you replot the graph,
the TI
-
86 updates the windo
w
variable values.
To store to
xFact
or
yFact
from the home screen or in
the program editor, you can
select it from the
VARS ALL
screen or enter it using
ALPHA and alpha keys.