
Calculator User Manual


Chapter 6: Graph Tools
101
06TOOLS.DOC TI-86, Chap 6, US English Bob Fedorisko Revised: 02/13/01 2:23 PM Printed: 02/13/01 3:01 PM Page 101 of 2206TOOLS.DOC TI-86, Chap 6, US English Bob Fedorisko Revised: 02/13/01 2:23 PM Printed: 02/13/01 3:01 PM Page 101 of 22
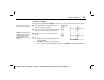
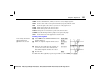
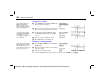
Evaluating a Function for a Specified x
Select
EVAL
from the
GRAPH
menu. The
graph is displayed with the
Eval x=
prompt in
the bottom-left corner.
Enter a real
x
value between window
variables
xMin
and
xMax
.
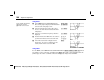
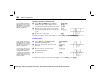
6 /
/ &
`
5
- ~
Evaluate. The result cursor is on the first
selected function at the entered
x
value. The
coordinate values are displayed. The number
in the top-right corner indicates which
function is evaluated.
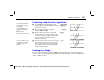
b
Move the result cursor to the next or previous
selected function. The result cursor is on the
next or previous function at entered
x
value,
the coordinate values are displayed, and the
function number changes.
$ #
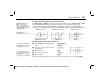
Drawing on a Graph
You can use the drawing tools (except
DrInv
) to draw points, lines, circles, shaded areas,
and text on the current graph in any graphing mode. The drawing tools use the display’s x-
and y-coordinate values.
To clear entered numbers
from the
Eval x=
prompt,
press
:
.
To cancel
EVAL
, press
:
after clearing the
Eval x=
prompt.
Expressions are valid for
x
.
You may continue to enter
valid
x
values for which to
evaluate the selected
functions.