
Calculator User Manual


104
Chapter 6: Graph Tools
06TOOLS.DOC TI-86, Chap 6, US English Bob Fedorisko Revised: 02/13/01 2:23 PM Printed: 02/13/01 3:01 PM Page 104 of 2206TOOLS.DOC TI-86, Chap 6, US English Bob Fedorisko Revised: 02/13/01 2:23 PM Printed: 02/13/01 3:01 PM Page 104 of 22
Shading Areas of a Graph
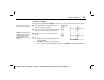
To shade an area of a graph, the syntax is:
Shade(
lowerFunc
,
upperFunc
ã
,
xLeft
,
xRight
,
pattern
,
patternRes
ä
)
pattern
specifies one of four shading patterns.
1
vertical (default)
2
horizontal
3
negative slope( 45
¡
)
4
positive slope (45
¡
)
patternRes
specifies one of eight shading resolutions.
1
every pixel (default)
2
every second pixel
3
every third pixel
4
every fourth pixel
5
every fifth pixel
6
every sixth pixel
7
every seventh pixel
8
every eighth pixel
♦
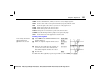
The area that is specifically above
lowerFunc
and below
upperFunc
is shaded.
♦
xLeft
>
xMin
and
xRight
<
xMax
must be true.
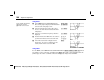
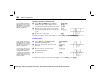
♦
xLeft
and
xRight
specify left and right bounds for shading. (
xMin
and
xMax
are defaults.)
These
GRAPH
DRAW
menu items are interactive. Also, you can use all of them, except
PEN
,
on the home screen or in a program (A to Z Reference).
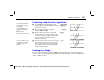
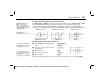
LINE
Draws a line segment from one point to another point you specify with the cursor
VERT
Draws a vertical line, which you can move to any displayed
x
value
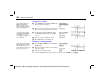
To replicate the example
without additional graphs,
turn off all equations and stat
plots before entering the
instructions as shown.