
Calculator User Manual


106
Chapter 6: Graph Tools
06TOOLS.DOC TI-86, Chap 6, US English Bob Fedorisko Revised: 02/13/01 2:23 PM Printed: 02/13/01 3:01 PM Page 106 of 2206TOOLS.DOC TI-86, Chap 6, US English Bob Fedorisko Revised: 02/13/01 2:23 PM Printed: 02/13/01 3:01 PM Page 106 of 22
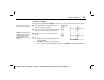
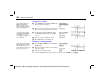
Drawing a Vertical or Horizontal Line
Select
VERT
(or
HORIZ
) from the
GRAPH
DRAW
menu. The graph is displayed and a
vertical or horizontal line is drawn at the cursor.
6 /
' (
(or ))
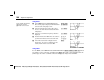
Move the line to the
x
value (or to the
y
value,
if horizontal) through which you want the line
to pass.
Draw the line on the graph.
! "
(or $ #)
b
To draw more lines, repeat steps 2 and 3; to cancel
VERT
or
HORIZ
, press
:
.
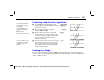
Drawing a Circle
Select
CIRCL
from the
GRAPH
DRAW
menu. The graph is displayed.
Define the center point of the circle with
the cursor.
6 / '
*
" # ! $
b
Move the cursor to any point on the
intended circumference.
Draw the circle.
" # ! $
b
To draw more circles, repeat steps 2 through 4; to cancel
CIRCL
, press
:
.
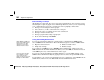
In the example, the function
y(x)=x^3+.3x
2
N
4x
is selected.
Also,
ZIN
was executed once
with the zoom cursor at (0,0),
xFact=2
, and
yFact=2
.
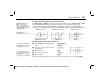
In the example, the function
y(x)=x^3+.3x
2
N
4x
is selected.
Also,
ZIN
was executed once
with the zoom cursor at (0,0),
xFact=2
, and
yFact=2
.
Here the circle appears as a
circle, regardless of window
variable values. When you
use
Circl(
from the
CATALOG
to draw a circle, the current
window variable values may
distort the shape.