
Calculator User Manual


Chapter 8: Polar Graphing
119
08POL.DOC TI-86, Chap 8, US English Bob Fedorisko Revised: 02/13/01 2:26 PM Printed: 02/13/01 3:02 PM Page 119 of 808POL.DOC TI-86, Chap 8, US English Bob Fedorisko Revised: 02/13/01 2:26 PM Printed: 02/13/01 3:02 PM Page 119 of 8
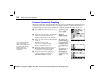
Setting the Graph Format
To display the format screen in
Pol
graphing mode, select
FORMT
from the
GRAPH
menu
(
6
/
(
). Chapter 5 describes the format settings. Although the same settings are
available for
Func
,
Pol
, and
Param
graphing modes, the TI
-
86 retains in memory separate
format settings for each mode. In
Pol
graphing mode,
PolarGC
shows the cursor coordinates
in terms of
r
and
q
, the variables that define the equations.
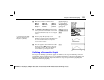
Displaying the Graph
To plot the selected polar equations, you can select
GRAPH
,
TRACE
,
EVAL
,
RCGDB
, or a
ZOOM
,
MATH
,
DRAW
, or
RCPIC
operation, from the
GRAPH
menu. The TI
-
86 evaluates
r
for
each value of
q
(from
q
Min
to
q
Max
in intervals of
q
Step
) and then plots each point. As the
graph is plotted, the variables
q
,
r
,
x
, and
y
are updated.
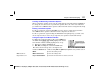
Using Graph Tools in Pol Graphing Mode
The Free-Moving Cursor
The free-moving cursor in
Pol
graphing works the same as in
Func
graphing.
♦
In
RectGC
format, moving the cursor updates the values of
x
and
y
; if
CoordOn
format is
selected,
x
and
y
are displayed.
♦
In
PolarGC
format, moving the cursor updates
x
,
y
,
r
, and
q
; if
CoordOn
format is
selected,
r
and
q
are displayed.
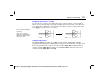
DrawLine
graph format
typically displays a more
meaningful polar graph than
DrawDot
graph format.