
Calculator User Manual


Chapter 8: Polar Graphing
121
08POL.DOC TI-86, Chap 8, US English Bob Fedorisko Revised: 02/13/01 2:26 PM Printed: 02/13/01 3:02 PM Page 121 of 808POL.DOC TI-86, Chap 8, US English Bob Fedorisko Revised: 02/13/01 2:26 PM Printed: 02/13/01 3:02 PM Page 121 of 8
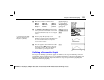
Moving the Trace Cursor to a
q
Value
To move the trace cursor to any valid
q
value on the current equation, enter the number.
When you enter the first digit, a
q
=
prompt is displayed in the bottom-left corner. The value
you enter must be valid for the current graph screen. When you have completed the entry,
press
b
to reactivate the trace cursor.
Using Zoom Operations
The
GRAPH
ZOOM
menu items, except
ZFIT
, work the same in
Pol
graphing as in
Func
graphing. In
Pol
graphing mode,
ZFIT
adjusts the graph screen in both the x and y directions.
The zoom operations affect only the
x
window variables (
xMin
,
xMax
, and
Xscl
) and the
y
window variables (
yMin
,
yMax
, and
yScl
), except
ZSTO
and
ZRCL
, which also affect the
q
window variables (
q
Min
,
q
Max
, and
q
Step
).
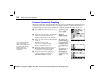
In the example,
r1=8sin(2.5
q
)
is graphed.
Values for
q
,
x
, and
y
are
displayed on the graph to the
right because
RectGC
graph
format is selected.