
Calculator User Manual

Chapter 9: Parametric Graphing
129
09PARA.DOC TI-86, Chap 9, US English Bob Fedorisko Revised: 02/13/01 2:27 PM Printed: 02/13/01 3:02 PM Page 129 of 809PARA.DOC TI-86, Chap 9, US English Bob Fedorisko Revised: 02/13/01 2:27 PM Printed: 02/13/01 3:02 PM Page 129 of 8
♦
In
PolarGC
format, moving the trace cursor updates
x
,
y
,
r
,
q
, and
t
; if
CoordOn
format is
selected,
r
,
q
, and
t
are displayed. The
x
and
y
(or
r
and
q
) values are calculated from
t
.
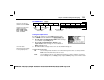
To move the trace cursor... Press:
Along the graph of the equation by increments or decrements of
tStep
"
or
!
From one equation to another
#
or
$
If you move the trace cursor beyond the top or bottom of the graph screen, the coordinate
values at the bottom of the screen continue to change appropriately. If you have graphed a
family of curves,
#
and
$
move through each curve before moving to the next parametric
function.
Moving the Trace Cursor to a t Value
To move the trace cursor to any valid
t
value on the current equation, enter the number.
When you enter the first digit, a
t=
prompt is displayed in the bottom-left corner. The value
you enter must be valid for the current graph screen. When you have completed the entry,
press
b
to reactivate the trace cursor.
Using Zoom Operations
The
GRAPH
ZOOM
menu items, except
ZFIT
, work the same in
Param
graphing as in
Func
graphing. In
Param
mode,
ZFIT
adjusts the graph screen in both the x and y directions.
QuickZoom is available in
Param
graphing; panning is
not (Chapter 6).
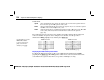
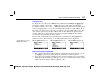
You can enter an expression
at the
t=
prompt.
In the example, the
parametric equation is:
xt1=95t cos 30
¡
yt1=95t sin 30
¡
N
16t
2
Also,
AxesOn
graph format is
set.
(The example on page 124 is
similar to this example.)