
Calculator User Manual

Chapter 10: Differential Equation Graphing
141
10DIFFEQ.DOC TI-86, Chap 10, US English Bob Fedorisko Revised: 02/13/01 2:28 PM Printed: 02/13/01 3:02 PM Page 141 of 2010DIFFEQ.DOC TI-86, Chap 10, US English Bob Fedorisko Revised: 02/13/01 2:28 PM Printed: 02/13/01 3:02 PM Page 141 of 2010DIFFEQ.DOC TI-86, Chap 10, US English Bob Fedorisko Revised: 02/13/01 2:28 PM Printed: 02/13/01 3:02 PM Page 141 of 20
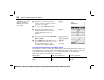
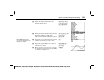
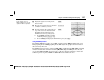
Graphing in DirFld Format
Display the mode screen and set
DifEq
graphing mode.
- m # # #
# " " " b
Display the format screen and set
DirFld
graphing format.
6 / & #
# # # # " b
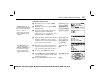
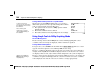
Display the equation editor and store the
transformed system of differential
equations for y''=
L
y to the equation editor,
substituting
Q1
for y and
Q2
for y'.
& '
2
# a '
1
Display the initial conditions editor and enter
the initial conditions if you want a specific
solution. To enter a list of initial conditions,
use
{
and
}
from the
LIST
menu.
- g - ”
&
1
P
2
P
5
'
# & -~ P
4
P
5
`
75
'
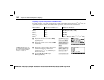
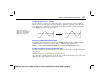
Display the axes editor and enter the two
equation variables for which you want to
solve. You must omit the prime mark (
'
).
Accept or change
fldRes
(resolution).
- h &
1
#
&
2
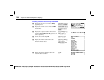
Select
ZSTD
from the
GRAPH
ZOOM
menu
to set the standard window variable values
and display the graph.
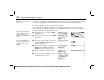
Clear the
GRAPH
menu from the screen.
. / ( )
:
In
DifEq
graphing mode,
t
is
the independent variable and
Q'
n
is the dependent variable,
where
n
‚
1 and
9.
In the example, the default
window variable values are
set initially.
When
DirFld
field format is
selected,
x=Q1
,
y=Q2
,
dTime=0
, and
fldRes=15
are
the default axes settings.
Since
t
is not part of the
equation,
dTime
is ignored.