
Calculator User Manual

Chapter 10: Differential Equation Graphing
145
10DIFFEQ.DOC TI-86, Chap 10, US English Bob Fedorisko Revised: 02/13/01 2:28 PM Printed: 02/13/01 3:02 PM Page 145 of 2010DIFFEQ.DOC TI-86, Chap 10, US English Bob Fedorisko Revised: 02/13/01 2:28 PM Printed: 02/13/01 3:02 PM Page 145 of 2010DIFFEQ.DOC TI-86, Chap 10, US English Bob Fedorisko Revised: 02/13/01 2:28 PM Printed: 02/13/01 3:02 PM Page 145 of 20
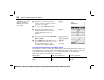
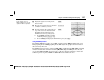
Moving the Trace Cursor to a t Value
To move the trace cursor to any valid
t
value on the current equation, enter the number.
When you enter the first digit, a
t=
prompt is displayed in the bottom-left corner. The value
you enter must be valid for the current graph screen. When you have completed the entry,
press
b
to reactivate the trace cursor.
Drawing on a Differential Equation Graph
The
GRAPH
DRAW
menu items work the same in
DifEq
graphing mode as in
Func
graphing.
DRAW
instruction coordinates are the x- and y-coordinates of the graph screen.
DrEqu
is available only in
DifEq
mode.
DrInv
is not available in
DifEq
graphing mode.
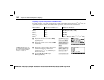
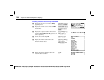
Drawing an Equation and Storing Solutions to Lists
To draw a solution on the current graph screen and store the results to specified list names,
the syntax is:
DrEqu(
xAxisVariable
,
yAxisVariable
ã
,
xList
,
yList
,
tList
ä
)
xAxisVariable
and
yAxisVariable
specify the axes on which the drawing is based; they may
differ from the current graph screen’s axes settings.
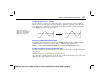
Values for
t
and
Q
are
displayed on the graph to the
right because
x=t
and
y=Q
graph axes are selected.