
Calculator User Manual

146
Chapter 10: Differential Equation Graphing
10DIFFEQ.DOC TI-86, Chap 10, US English Bob Fedorisko Revised: 02/13/01 2:28 PM Printed: 02/13/01 3:02 PM Page 146 of 2010DIFFEQ.DOC TI-86, Chap 10, US English Bob Fedorisko Revised: 02/13/01 2:28 PM Printed: 02/13/01 3:02 PM Page 146 of 2010DIFFEQ.DOC TI-86, Chap 10, US English Bob Fedorisko Revised: 02/13/01 2:28 PM Printed: 02/13/01 3:02 PM Page 146 of 20
xList
,
yList
, and
tList
are optional list names to which you can store the solutions
x
,
y
, and
t
. You then can display the lists on the home screen or in the list editor (Chapter 11).
Use the free-moving cursor to select initial conditions.
You cannot trace the drawing. However, you can plot
xList
,
yList
, or
tList
as a stat plot
after you draw the equation, and then trace them (Chapter 14). Also, you can fit statistical
regression models to the lists (Chapter 14).
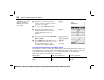
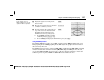
Display the mode screen and set
DifEq
graphing mode.
-
m
#
#
#
#
"
"
"
b
Display the format screen and set
DirFld
field format.
6
/
&
#
#
#
#
#
"
b
Display the equation editor and store the
equations
Q'1=Q2
and
Q'2=
L
Q1
. (Delete
all other equations.)
&
'
2
#
a
'
1
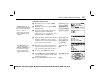
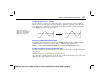
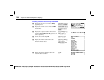
Remove the format screen, and then select
DrEqu
from the
GRAPH
DRAW
menu.
DrEqu(
is pasted to the home screen.
.
.
6
/
'
&
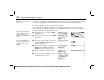
Assign variables to the x- and y-axes.
Specify list names to which to store the
solution lists for
x
,
y
, and
t
.
1
ã
Q
ä
1
P
1
ã
Q
ä
2
P
1
ã
L
ä
1
ã
X
ä
P
1
ã
L
ä
1
ã
Y
ä
P
1
ã
L
ä
1
ã
T
ä
E
DrEqu(
does not store values
to
x
,
y
, or
t
.
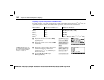
In the example, the default
window variable values are
set. If necessary, select
ZSTD
from the
GRAPH
ZOOM
menu.
If you select
FldOff
field
format, you must enter initial
conditions before you use
DrEqu(
.