
Calculator User Manual

Chapter 10: Differential Equation Graphing
147
10DIFFEQ.DOC TI-86, Chap 10, US English Bob Fedorisko Revised: 02/13/01 2:28 PM Printed: 02/13/01 3:02 PM Page 147 of 2010DIFFEQ.DOC TI-86, Chap 10, US English Bob Fedorisko Revised: 02/13/01 2:28 PM Printed: 02/13/01 3:02 PM Page 147 of 2010DIFFEQ.DOC TI-86, Chap 10, US English Bob Fedorisko Revised: 02/13/01 2:28 PM Printed: 02/13/01 3:02 PM Page 147 of 20
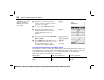
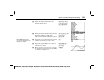
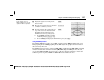
Display the graph screen and plot the
direction field.
Move the free-moving cursor to the initial
condition coordinates you want.
b
" # ! $
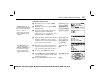
Draw the solution. The solution lists for
x
,
y
, and
t
are stored to
LX
,
LY
, and
LT
.
The
Again?
prompt is displayed and
ALPHA-lock is on for
ã
Y
ä
and
ã
N
ä
only.
♦
To use
DrEqu(
again with new initial
conditions, press
ã
Y
ä
, ", #, !, or $.
b
♦
To leave
DrEqu(
and display the
GRAPH
menu, press
ã
N
ä
or ..
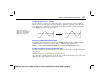
Using ZOOM Operations
The
GRAPH
ZOOM
menu items, except
ZFIT
, work the same in
DifEq
graphing mode as in
Func
graphing mode. In
DifEq
graphing mode,
ZFIT
adjusts the graph screen in both the x
direction and y direction.
The
ZOOM
menu items affect only the
x
(
xMin
,
xMax
, and
xScl
) and
y
(
yMin
,
yMax
, and
yScl
)
window variables. The
t
window variables (
tMin
,
tMax
,
tStep
, and
tPlot
) are not affected,
except with
ZSTD
and
ZRCL
. You may want to edit the
t
window variables to ensure that
sufficient points are plotted.
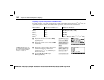
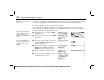
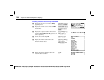
ZSTD
sets
difTol=.001
and
t
and
Q
as the axes.
In the example, since no
initial conditions were set, the
equation in
Q'1
is not plotted.