
Calculator User Manual

188
Chapter 14: Statistics
14STATS.DOC TI-86, Chap 14, US English Bob Fedorisko Revised: 02/13/01 2:33 PM Printed: 02/13/01 3:04 PM Page 188 of 1414STATS.DOC TI-86, Chap 14, US English Bob Fedorisko Revised: 02/13/01 2:33 PM Printed: 02/13/01 3:04 PM Page 188 of 1414STATS.DOC TI-86, Chap 14, US English Bob Fedorisko Revised: 02/13/01 2:33 PM Printed: 02/13/01 3:04 PM Page 188 of 14
Statistical Analysis on the TI-86
With the TI
-
86, you can analyze one-variable and two-variable statistical data, which are
stored in lists. One-variable data has one measured variable. Two-variable data has pairs
comprising an independent variable and a dependent variable.
When analyzing either kind of data, you can specify a frequency of occurrence for the
independent variable values. These specified frequencies must be real numbers
‚
0.
Setting Up a Statistical Analysis
Enter the statistical data into one or more lists (Chapter 11).
Calculate the statistical variables or fit a model to the data.
Plot the data.
Graph the regression equation for the plotted data.
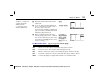
The STAT (Statistics) Menu
-
š
CALC EDIT PLOT DRAW VARS
4
FCST
statistical stat plot statistical result
calculations menu variables menu
menu list editor statistical drawing forecast
tools menu editor
The same list editor is
displayed, whether you press
-
š
'
or
-
”
)
.
For a description of the list
editor, see Chapter 11.