
Calculator User Manual

194
Chapter 14: Statistics
14STATS.DOC TI-86, Chap 14, US English Bob Fedorisko Revised: 02/13/01 2:33 PM Printed: 02/13/01 3:04 PM Page 194 of 1414STATS.DOC TI-86, Chap 14, US English Bob Fedorisko Revised: 02/13/01 2:33 PM Printed: 02/13/01 3:04 PM Page 194 of 1414STATS.DOC TI-86, Chap 14, US English Bob Fedorisko Revised: 02/13/01 2:33 PM Printed: 02/13/01 3:04 PM Page 194 of 14
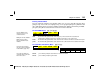
Plotting Statistical Data
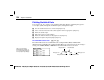
You can plot one, two, or three sets of statistical list data. The five available plot types are
scatter plot, xyLine, histogram, modified box plot, and regular box plot.
Store the statistical data in one or more lists (Chapter 11).
Select or deselect functions in the current equation editor as appropriate (Chapter 5).
Define the statistical plot.
Turn on the plots you want to display.
Define the window variables for the graph screen (Chapter 5).
Display and explore the plotted graph (Chapter 6).
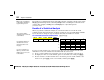
The STAT PLOT Status Screen
-
š
(
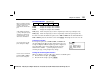
The
STAT
PLOT
status screen summarizes the settings for
Plot1
,
Plot2
, and
Plot3
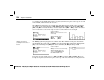
. The
illustration below identifies the settings for
Plot1
. This screen is not interactive. To change a
setting, select
PLOT1
,
PLOT2
, or
PLOT3
from the
STAT
PLOT
status screen menu.
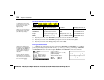
Stat plot name On
à
Off status
1:Plot1...
O
ff
Plot-type icon
®
xStat
yStat
›
Mark-type icon
Independent list name Dependent list name
This screen shows the
default stat plot settings. If
you select another plot type,
some prompts may change.