
Calculator User Manual

Chapter 14: Statistics
197
14STATS.DOC TI-86, Chap 14, US English Bob Fedorisko Revised: 02/13/01 2:33 PM Printed: 02/13/01 3:04 PM Page 197 of 1414STATS.DOC TI-86, Chap 14, US English Bob Fedorisko Revised: 02/13/01 2:33 PM Printed: 02/13/01 3:04 PM Page 197 of 14
−
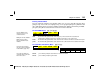
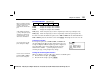
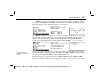
xyLINE
is a scatter plot in which the data points are plotted and connected in order of
appearance in
Xlist Name
and
Ylist Name
. You may want to use
SortA
or
SortD
from the
LIST
OPS
menu (Chapter 11) to sort the lists before you plot them.
For the example:
xStat={1 2 3 4 5 6 7 8 9 10}
yStat=5 sin(xStat)
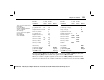
Window variable values:
xMin=0
yMin=
L
10
xMax=10
yMax=10
¯
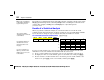
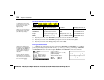
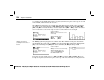
MBOX
(modified
box plot) plots one-variable data, like the regular box plot, except that
the points are 1.5
¹
Interquartile Range beyond the quartiles. (The Interquartile Range is
defined as the difference between the third quartile
Q
3
and the first quartile
Q
1
.) These
points are plotted individually beyond the whisker, using the
Mark
(
›
or
+
or
¦
) you select.
For the example:
xStat={1 2 2 2.5 3 3.3 4 4 2 6 9}
Window variable values are
set by selecting
ZDATA
from
the
GRAPH
ZOOM
menu.
You can trace these points, which are called outliers. When outliers exist, the end of each
whisker will display an
x=
prompt. When no outliers exist,
xMin
and
xMax
are the prompts for
the end of each whisker.
Q
1
,
Med
(median), and
Q
3
define the box.
Modified box plots are plotted with respect to
xMin
and
xMax
, but ignore
yMin
and
yMax
.
When two modified box plots are plotted, the first one plots at the top of the screen and the
Whiskers are the lines
protruding from the sides of
the box.