
Calculator User Manual

198
Chapter 14: Statistics
14STATS.DOC TI-86, Chap 14, US English Bob Fedorisko Revised: 02/13/01 2:33 PM Printed: 02/13/01 3:04 PM Page 198 of 1414STATS.DOC TI-86, Chap 14, US English Bob Fedorisko Revised: 02/13/01 2:33 PM Printed: 02/13/01 3:04 PM Page 198 of 1414STATS.DOC TI-86, Chap 14, US English Bob Fedorisko Revised: 02/13/01 2:33 PM Printed: 02/13/01 3:04 PM Page 198 of 14
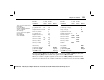
second plots in the middle. When three are plotted, the first one plots at the top, the second
in the middle, and the third at the bottom.
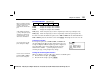
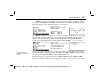
¬
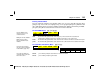
HIST
(histogram) plots one-variable data. The
xScl
window variable value determines
the width of each bar, beginning at
xMin
.
ZDATA
(
GRAPH
ZOOM
menu) adjusts
xMin
,
xMax
,
yMin
, and
yMax
to include all values, and also adjusts
xScl
. (
xMax
N
xMin
)
à
xScl
47 must be
true. A value that occurs on the edge of a bar is counted in the bar to the right.
For the example:
xStat={1 2 2 2 3 8 9 5 6 6 7 7
4 4 9 9 9}
Window variable values:
xMin=0
yMin=0
xMax=10
yMax=5
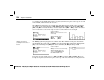
°
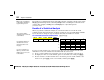
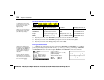
BOX
(regular box plot) plots one-variable data. The whiskers on the plot extend from
the minimum data point in the set (
xMin
) to the first quartile (
Q
1
) and from the third quartile
(
Q
3
) to the maximum point (
xMax
). The box is defined by
Q
1
,
Med
(median), and
Q
3
.
For the example:
xStat={1 2 2 2.5 3 3.3 4 4 2 6 9}
Window variable values are
set by selecting
ZDATA
from
the
GRAPH
ZOOM
menu.
Box plots are plotted with respect to
xMin
and
xMax
, but ignore
yMin
and
yMax
. When two
box plots are plotted, the first one plots at the top of the screen and the second plots in the
Whiskers are the lines
protruding from the sides of
the box.