
Calculator User Manual

Chapter 14: Statistics
199
14STATS.DOC TI-86, Chap 14, US English Bob Fedorisko Revised: 02/13/01 2:33 PM Printed: 02/13/01 3:04 PM Page 199 of 1414STATS.DOC TI-86, Chap 14, US English Bob Fedorisko Revised: 02/13/01 2:33 PM Printed: 02/13/01 3:04 PM Page 199 of 14
middle. When three are plotted, the first one plots at the top, the second in the middle, and
the third at the bottom.
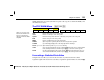
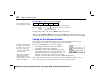
The STAT DRAW Menu
-
š
)
CALC EDIT PLOT DRAW VARS
HIST SCAT xyLINE BOX MBOX
4
DRREG CLDRW DrawF STPIC RCPIC
HIST
Draws a histogram of one-variable data
SCAT
Draws a scatter plot of the data points
xyLINE
Draws the data points and a line connecting each point to the next point
BOX
Draws a box plot of the data points
MBOX
Draws a modified box plot of the data points
DRREG
(draw regression equation) Draws the current regression equation
CLDRW
(clear drawings) Displays the current graph with no drawings
DrawF
expression
(draw function) Plots
expression
as a drawing
STPIC
(store picture) Displays the picture variable
Name=
prompt; enter a valid variable
name, starting with a letter, and then press
b
to store the current picture
RCPIC
(recall picture) Displays the picture variable
Name=
prompt and menu; select or
enter a valid variable name, and then press
b
; the stored picture is redrawn
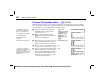
Forecasting a Statistical Data Value
Using the forecast editor, you can forecast an x-value or y-value based on the current
regression equation. To use the forecast editor, a regression equation must be stored to
RegEq
.
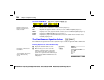
When you select any of the
first five
STAT
DRAW
menu
items, the TI
-
86 plots the
data stored in the lists
xStat
and
yStat
.