
Calculator User Manual

200
Chapter 14: Statistics
14STATS.DOC TI-86, Chap 14, US English Bob Fedorisko Revised: 02/13/01 2:33 PM Printed: 02/13/01 3:04 PM Page 200 of 1414STATS.DOC TI-86, Chap 14, US English Bob Fedorisko Revised: 02/13/01 2:33 PM Printed: 02/13/01 3:04 PM Page 200 of 1414STATS.DOC TI-86, Chap 14, US English Bob Fedorisko Revised: 02/13/01 2:33 PM Printed: 02/13/01 3:04 PM Page 200 of 14
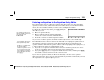
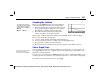
Enter stat data in the list editor. The screen to
the right shows all
fStat
elements as
1
, but you
need not enter them.
1
is the default for all
fStat
elements. However, if other elements are
stored to
fStat
, you must clear them.
- š '
`
1
#
1
`
1
#
2
#
4
#
5
# "
1
#
2
#
3
#
4
#
2
Display the home screen.
Execute a linear regression for
xStat
and
yStat
.
The statistical results are displayed.
Remove the
STAT
CALC
menu to display all
results, including
n
.
.
- š &
( b
.
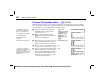
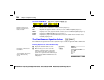
Display the forecast editor. The current
regression model is displayed on the top line.
Enter
x=3
, and then move the cursor to the
y=
prompt.
/ &
3
#
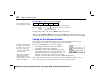
Select
SOLVE
from the forecast editor menu to
solve for
y
at
x=3
. A small square indicates the
solution. You can continue to use the forecast
editor with other values for
x
or
y
.
*
When you use
FCST
, the values of
x
,
y
, and
Ans
are not updated. To store the
x
value or
y
value, move the cursor onto the variable to be stored, press
X
, enter a valid variable
name at the
Sto
prompt, and then press
b
.
Values entered at forecast
editor prompts must be real
numbers or expressions that
evaluate to real numbers.
If the most recent calculation
was a polynomial regression,
you can only forecast the
y
value.