
Calculator User Manual

Chapter 15: Equation Solving
207
15EQSOLV.DOC TI-86, Chap 15, US English Bob Fedorisko Revised: 02/13/01 2:34 PM Printed: 02/13/01 3:04 PM Page 207 of 1215EQSOLV.DOC TI-86, Chap 15, US English Bob Fedorisko Revised: 02/13/01 2:34 PM Printed: 02/13/01 3:04 PM Page 207 of 12
Graphing the Solution
When you select
GRAPH
from the solver menu (
&
), the
solver graph is displayed with the free-moving cursor.
♦
The vertical axis represents the result of the left side
of the equation minus the right side of the equation
(left
N
right) at each independent variable value.
♦
The horizontal axis represents the independent
variable for which you solved the equation.
On the graph, solutions exist for the equation where
left
N
rt=0
, which is where the graph
intersects the x-axis. The solver graph:
♦
Uses the current window and format settings (Chapter 5).
♦
Does not graph the solution according to the current graphing mode.
♦
Always graphs a solution as a function graph.
♦
Does not graph selected functions or turned on stat plots along with the solution.
Solver Graph Tools
You can explore the graph of a solution with the free-moving cursor, as you would on any
other graph. When you do, the coordinate values for the variable (the x-axis) and the value
left
N
rt
(the y-axis) are updated.
To activate the trace cursor, select
TRACE
from the solver menu. Panning, QuickZoom, and
entering a specific value (Chapter 6) are available with the trace cursor on the solver graph.
To return to the solver menu from a trace, press
.
.
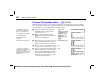
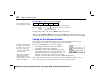
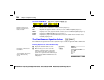
The graph to the right plots
the solution from the example
on page 202. The window
variable values are:
xMin=
L
10
yMin=
L
50
xMax=50
yMax=50
You can use the free-moving
cursor or trace cursor to
select a guess on the graph.