
Calculator User Manual

Quick Start
11
00QWIKST.DOC TI-86, Quick Start, US English Bob Fedorisko Revised: 02/13/01 1:51 PM Printed: 02/13/01 2:59 PM Page 11 of 1400QWIKST.DOC TI-86, Quick Start, US English Bob Fedorisko Revised: 02/13/01 1:51 PM Printed: 02/13/01 2:59 PM Page 11 of 14
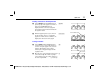
Plotting a Function on the Graph Screen
Select
GRAPH
from the
GRAPH
menu to
plot the graph on the graph screen. The x-
and y-axes and
GRAPH
menu are
displayed. Then each selected graph is
plotted in the order in which it is listed in
the equation editor.
- i
free-moving cursor
When the graph is plotted, you can move
the free-moving cursor (
+
) around the
graph screen. The cursor coordinates are
displayed at the bottom of the graph.
" # ! $
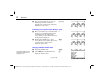
Tracing a Function
Select
TRACE
from the
GRAPH
menu to
activate the trace cursor, with which you
can trace along the graph of any selected
function. The number of the current
function (the
1
in
y1
) is displayed in the
top-right corner.
)
trace cursor
Move the trace cursor from the function
y1
to the function
y2
. The
1
in the top-right
corner changes to
2
; the
y
value changes to
the value of
y2
at
x=0
. (
continued
)
$