
Calculator User Manual

Chapter 19: Applications
249
19APPS.DOC TI-86, Chap 19, US English Bob Fedorisko Revised: 02/13/01 2:41 PM Printed: 02/13/01 3:05 PM Page 249 of 1819APPS.DOC TI-86, Chap 19, US English Bob Fedorisko Revised: 02/13/01 2:41 PM Printed: 02/13/01 3:05 PM Page 249 of 18
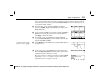
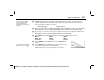
Select
TRACE
from the
GRAPH
menu to display the stat plot and
trace cursor on the graph screen.
Trace the stat plot to approximate the value of
POWER
at
CURR=125
. With this statistical data, the closest to
CURR=125
that you can trace to is
CURR=120
(on the y-axis).
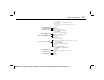
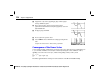
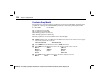
Select
INTER
from the
MATH
menu to display the
interpolate
à
extrapolate editor. To interpolate
POWER
at
CURR=125
, enter the nearest pairs:
x1=POWER(7) y1=CURR(7)
x2=POWER(8) y2=CURR(8)
Enter
y=125
and solve for
x
.
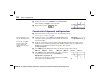
쐅
On the home screen, select
LinR
from the
STAT
CALC
menu to fit
the linear regression model equation to the data stored to
POWER
and
CURR
. Write down the value of the result variable
corr
.
쐈
Fit the logarithmic (
LnR
), exponential (
ExpR
), and power (
PwrR
) regressions to the data, writing
down the value of
corr
for each regression. Compare the
corr
values of each regression to
determine which model fits the data most accurately (the
corr
value closest to
1
).
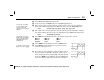
쐉
Execute the most accurate regression again, and then select
FCST
from the
STAT
menu. To forecast
POWER
at
CURR=125
,
enter
y=125
and solve for
x
.
Compare this answer with the answer returned in step 9.
The
7
s and
8
s in parentheses
specify the 7th and 8th
elements of
POWER
and
CURR
.
To enter each regression
after
LinR
, press
-
¢
and edit as needed.