
Calculator User Manual

Chapter 19: Applications
253
19APPS.DOC TI-86, Chap 19, US English Bob Fedorisko Revised: 02/13/01 2:41 PM Printed: 02/13/01 3:05 PM Page 253 of 1819APPS.DOC TI-86, Chap 19, US English Bob Fedorisko Revised: 02/13/01 2:41 PM Printed: 02/13/01 3:05 PM Page 253 of 18
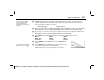
Next, use the list editor and a degree-three polynomial regression to find an analytic formula in
terms of
x
for the characteristic polynomial
y1=det(A
N
x¹ident 3)
. Create two lists that you can
use to find the analytic formula.
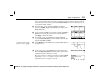
In the list editor, create elements for
xStat
by entering the
expression
seq(N,N,
L
10,21)
in the
xStat
entry line.
seq
is on the
MATH
MISC
menu.
Create elements for
yStat
by attaching the formula
"y1(xStat)"
to
yStat
in the entry line. The expression is evaluated when you
press b or exit the list editor.
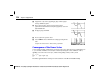
On the home screen, select
Plot1(
from the
CATALOG
and
execute
Plot1(2,xStat,yStat,1)
to turn on
Plot1
as an xyLine plot
using the lists
xStat
and
yStat
.
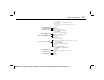
Select
GRAPH
from the
GRAPH
menu to display
Plot1
and
y1
on
the graph screen.
쐅
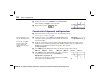
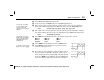
On the home screen, select
P3Reg
from the
STAT
CALC
menu.
Execute
P3Reg xStat,yStat,y2
to find the explicit characteristic
polynomial in terms of
x
and store it to
y2
.
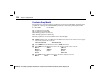
The cubic regression coefficients stored in the result list
PRegC
suggest that a=
L
1, b=0, c=14, and d=
L
24. So the characteristic
polynomial seems to be Cp(x)=
L
x
3
+14x
N
24.
To clear the menus from the
graph screen, press
:
.